BTC/USD Gets Ready to Hit $29,000 Resistance


Join Our Telegram channel to stay up to date on breaking news coverage
As the Bitcoin price prediction shoots above $28,500, the bulls are ready to push the king coin to hit the resistance level of $29,000.
Bitcoin Prediction Statistics Data:
Bitcoin price now – $28,474
Bitcoin market cap – $550.6 billion
Bitcoin circulating supply – 19.3 million
Bitcoin total supply – 19.3 million
Bitcoin Coinmarketcap ranking – #1
BTC/USD Long-term Trend: Bullish (Daily Chart)
Key levels:
Resistance Levels: $33,000, $35,000, $37,000
Support Levels: $24,000, $22,000, $20,000
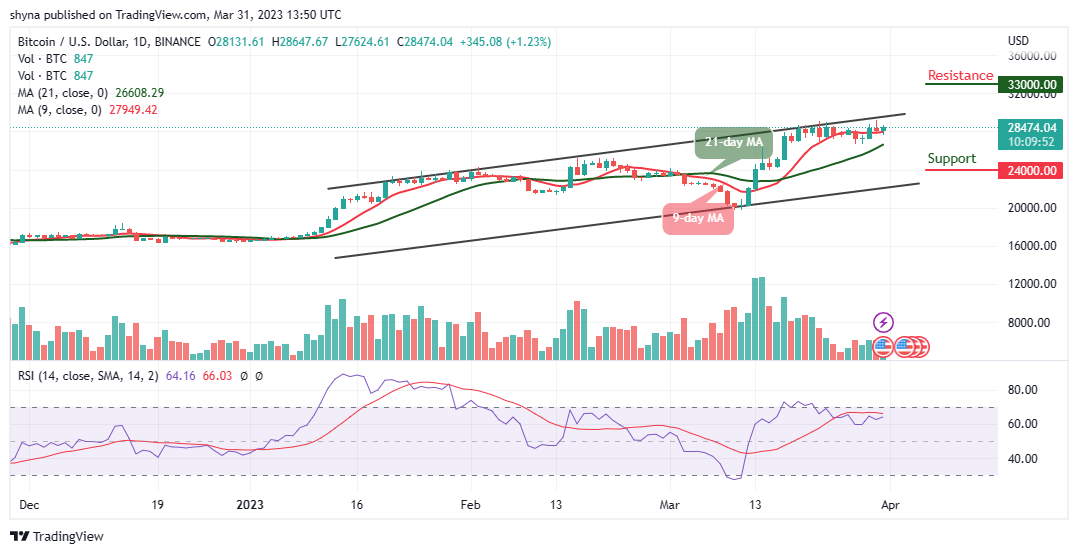
BTC/USD is following a bullish movement, and the king coin may begin an increase above the 9-day and 21-day moving averages. At the beginning of today’s trading, the Bitcoin price sees a steady rise toward the $29,000 resistance level, and the Bitcoin price hits the daily high at $28,647. At the time of writing, BTC/USD is likely to settle above the upper boundary of the channel to increase the bullish movement.
Bitcoin Price Prediction: BTC Price May Rise to the Upside
The Bitcoin price is seen retracing and trading above the 9-day and 21-day moving averages as the market price prepares to cross above the upper boundary of the channel. However, any further increase in the bullish movement could increase the current market value to reach the nearest resistance at $29,000. The buyers may locate the potential resistance levels at $33,000, $35,000, and $37,000 if the bulls put in more effort.
In the meantime, if the resistance level of $28,500 fails to hold, it may reverse and face the support level of $27,500, further increase in the bears’ pressure may bring down the price below the moving averages, and this could cause the king coin to hit the support levels at $24,000, $22,000, and $20,000 respectively. Moreover, the technical indicator Relative Strength Index (14) may cross into the overbought region to increase the bullish movement.
BTC/USD Medium-term Trend: Ranging (4H Chart)
On the 4-hour chart, the Bitcoin price is hovering above the 9-day and 21-day moving averages at a price value of $28,551. With the look of things, the bulls may continue to push the price toward the upper boundary of the channel, but any bearish cross below the lower boundary of the channel may bring the coin toward the support level of $26,500 and below.
Moreover, if the Bitcoin price finds a decent resistance level at $29,000 level, the first digital asset may continue the bullish movement near the upper boundary of the channel to hit the resistance level of $30,500 and above. Presently, the technical indicator Relative Strength Index (14) may cross above the 60-level, suggesting additional bullish signals into the market.
Alternatives to Bitcoin
At the moment, traders could see that the Bitcoin price is heading toward the north as the 9-day MA trend line is moving above the 21-day MA preparing to create more upsides. However, the technical indicator Relative Strength Index (14) is likely to cross into the overbought region in an attempt to retain the bullish movement. On that note, the LHINU token powers the whole Love Hate Inu ecosystem. It is an ERC 20 token that can be staked for rewards when you vote on polls powered by Love Hate Inu. As a result, none of the tokens are for developers – or for the ecosystem as a whole. The total tokens in the presale are 100 billion, with 90% going toward the presale as almost $2.5 million has been raised so far in the ongoing presale.
Love Hate Inu – Newest Meme Coin

Early Access Presale Live Now
Ethereum Chain
Featured in Yahoo Finance
Mint Memes of Survey Results as NFTs
Staking Rewards
Viral Potential, Growing Community
Join Our Telegram channel to stay up to date on breaking news coverage


