BTC/USD May Cross Above $50,000

Bitcoin Price Prediction – October 4
The Bitcoin price is currently trading above the resistance level of $49,000 as the coin plans to continue higher.
BTC/USD Long-term Trend: Ranging (Daily Chart)
Key levels:
Resistance Levels: $52,000, $54,000, $56,000
Support Levels: $45,000, $43,000, $41,000
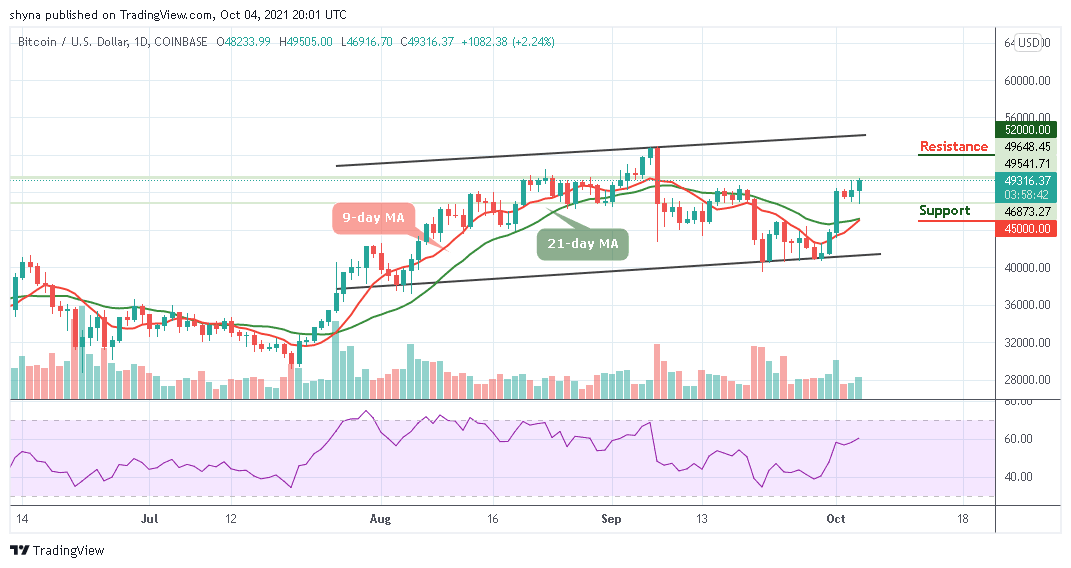
BTC/USD begins the day with a downside movement as the coin touched $46,916 in the early hours of today, but at the time of writing, the king coin is now improving by moving towards the upper boundary of the channel. However, within a few hours of the day, BTC/USD is now moving up to touch the daily high of $49,505 and now changing hands at $49,316.
Bitcoin Price Prediction: BTC Price Ready to Cross Above $50,000 Level
At the moment, the Bitcoin price is yet to hit $50,000 resistance as the coin keeps moving to the upside above the 9-day and 21-day moving averages. Meanwhile, when the new bullish movement begins to form, the Bitcoin (BTC) may use the 21-day moving average as the nearest support level. But in as long as the 9-day MA crosses above the 21-day MA, the market may continue to follow the upward movement.
However, if the market decides to go down, traders may see a further drop to $45,000, $43,000, and critically $41,000. More so, the resistance levels are located at $52,000, $54,000, and $56,000 respectively. Meanwhile, the signal line of the Relative Strength Index (14) could cross above the 60-level to suggest more bullish signals.

BTC/USD Medium – Term Trend: Bullish (4H Chart)
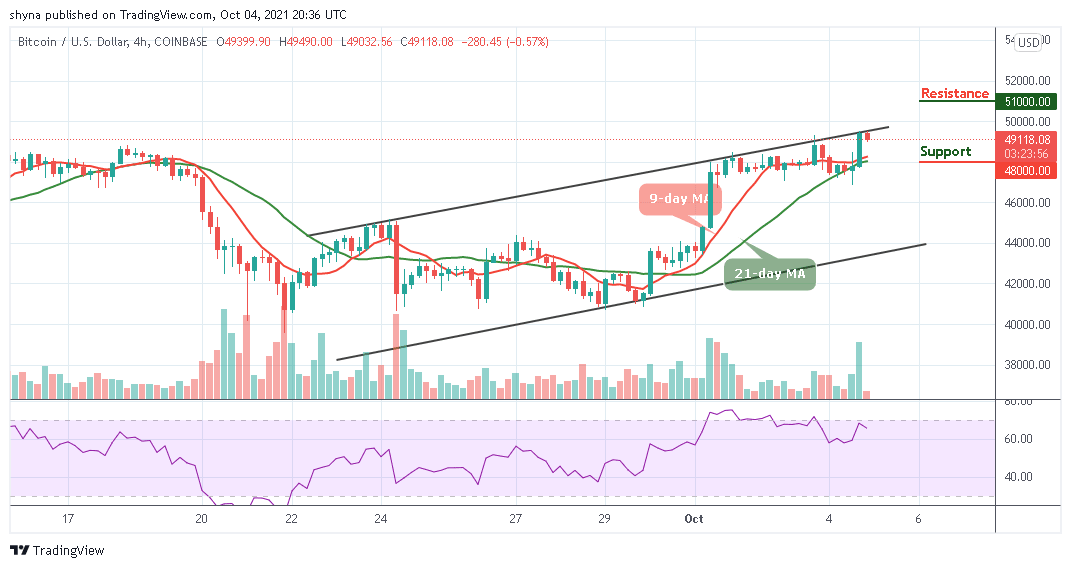
Looking at the 4-hour chart, the Bitcoin price is currently trading around $49,118 above the 9-day and 21-day moving averages. The chart also reveals that the bullish supply is coming up slowly in the market as the bears are also dragging the price down. Meanwhile, the $48,000 level and below may come into play if BTC breaks below the moving averages.

Meanwhile, as soon as bulls push the coin above the upper boundary of the channel, traders can expect more uptrends. Therefore, breaking the mentioned barrier could also allow the bulls to touch the resistance level of $51,000 and above. However, BTC/USD is consolidating currently on the medium-term outlook as the Relative Strength Index (14) moves around 65-level.
Looking to buy or trade Bitcoin (BTC) now? Invest at eToro!
67% of retail investor accounts lose money when trading CFDs with this provider
Read more:


