BTC/USD Short-term Bears Target $19k


Join Our Telegram channel to stay up to date on breaking news coverage
The Bitcoin (BTC) price prediction is falling again in a narrow channel after consolidating but buying interest could pick up if the price approaches $19,000.
Bitcoin Prediction Statistics Data:
Bitcoin price now – $19,173
Bitcoin market cap – $367.5 billion
Bitcoin circulating supply – 19.1 million
Bitcoin total supply – 19.1 million
Bitcoin Coinmarketcap ranking – #1
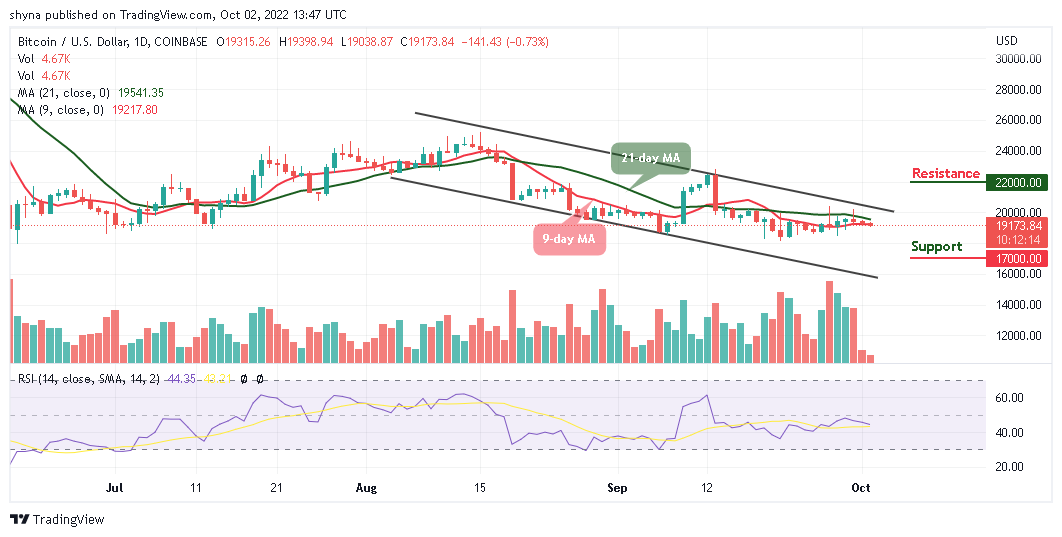
BTC/USD Long-term Trend: Bearish (Daily Chart)
Key levels:
Resistance Levels: $22,000, $23,000, $24,000
Support Levels: $17,000, $16,000, $15,000
Buy Bitcoin Now
Your capital is at risk
During the European session today, BTC/USD begins the day with the resistance level of $19,315 and it is now dropping below the 9-day moving average at the time of writing. However, the psychological barrier of $19,398 still serves as the first important resistance within the market and a sustainable move above the 21-day moving average may likely push the price towards the resistance level of $20,000.
Bitcoin Price Prediction: Will BTC Drop More?
On the intraday chart, the Bitcoin price is likely to break below the 9-day moving average, which may increase the selling pressure. At the time of writing, BTC/USD is hovering at $19,173 and if this is cleared, the dips to $19,000 are likely to be bought, which means the overall bullish sentiments may prevail.
Moreover, if the price moves below the mentioned support, $18,000 could come into focus which served as support during the previous consolidation period while the critical supports lie at $17,000, $16,000, and $15,000. Looking at the upside, the first resistance may likely come at $20,000 if the king coin rebounded. Once this is done, $21,000 could come back into focus. Further bullish movement may hit the potential resistance levels at $22,000, $23,000, and $24,000 as the Relative Strength Index (14) moves below 50-level.
BTC/USD Medium-term Trend: Ranging (4H Chart)
The 4-hour chart shows that the Bitcoin bears are still in play within the market keeping the Bitcoin price below the 9-day and 21-day moving averages. Although BTC/USD has not yet slipped below $19,000, it’s still in the loop of making a bounce back.
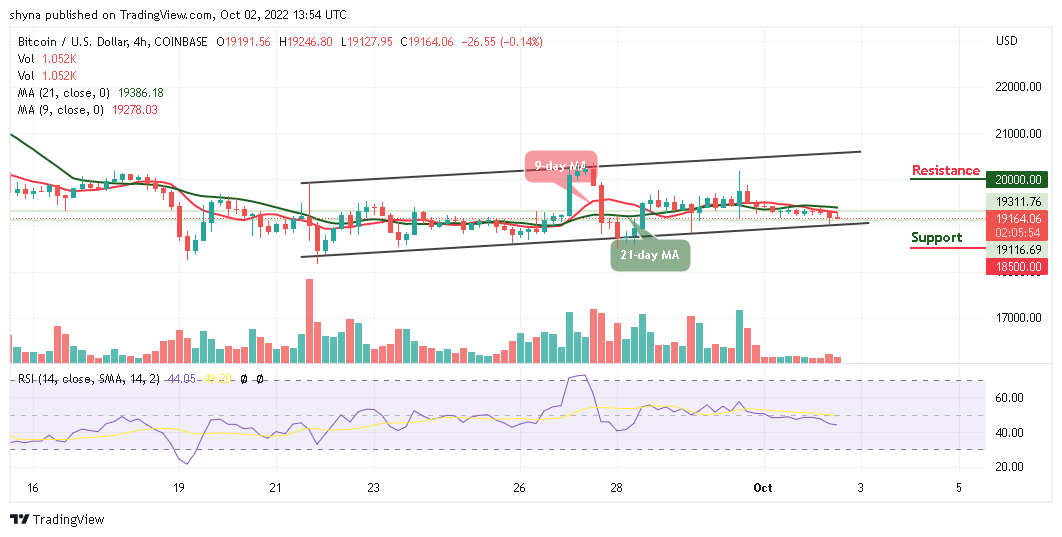
Moreover, the Bitcoin price is currently hovering below the moving averages at the time of writing. The upward movement could push the price to the resistance of $20,000 and above while the immediate support lies at $18,500 and below. The Relative Strength Index (14) is moving in the same direction below the 50-level, which indicates sideways movement.
Tamadoge – Play to Earn Meme Coin

Maximum Supply of 2 Bn, Token Burn
Now Listed on OKX, Bitmart, Uniswap
Upcoming Listings on LBank, MEXC
Join Our Telegram channel to stay up to date on breaking news coverage