BTC/USD Slumps as Price Targets $26,500 Support

Join Our Telegram channel to stay up to date on breaking news coverage
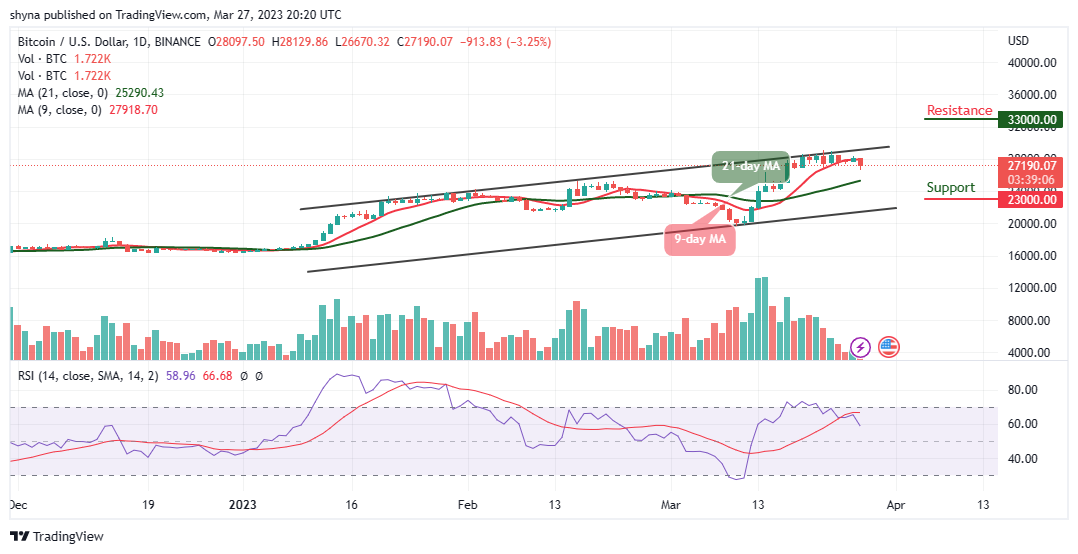
The Bitcoin price prediction shows that BTC may continue to fall if the price slide below the 21-day moving average.
Bitcoin Prediction Statistics Data:
Bitcoin price now – $27,190
Bitcoin market cap – $522.5 billion
Bitcoin circulating supply – 19.3 million
Bitcoin total supply – 19.3 million
Bitcoin Coinmarketcap ranking – #1
BTC/USD Long-term Trend: Ranging (Daily Chart)
Key levels:
Resistance Levels: $33,000, $35,000, $37,000
Support Levels: $23,000, $21,000, $19,000
BTC/USD begins the day with the opening price of $28,097 but after touching the daily high of $28,129, the king coin begins to bleed as the market price crosses below the support level of $27,000 to hit the daily low at $26,670.
Bitcoin Price Prediction: Will Bitcoin Price Drop More?
Looking at the daily chart, the Bitcoin price is likely to break below the 21-day moving average, which could increase the selling pressure. At the time of writing, BTC/USD is hovering at $27,190 and if this is cleared, the dips to $26,500 are likely to be bought.
Moreover, if the price slides below the support level of $26k, another support of $25,000 may likely come into focus while the critical supports could be found at $23,000, $21,000, and $19,000. However, any bullish cross above the upper boundary of the channel could hit the first resistance at $28,500. Once this is done, $29,000 may come likely play out as any further bullish movement may hit the potential resistance levels at $33,000, $35,000, and $37,000 as the Relative Strength Index (14) moves to cross below the 60-level.
BTC/USD Medium-term Trend: Ranging (4H Chart)
The 4-hour chart shows that the Bitcoin bears are still dragging the coin to the downside. Although BTC/USD is hovering below the 9-day and 21-day moving averages as it has not yet slipped below $26,000 it’s still in the loop of making a bounce back.
Meanwhile, the Bitcoin price may continue to hover below the moving averages, but the bullish movement could push the price to the resistance of $30,000 and above while the immediate support lies at $25,000 and below. The Relative Strength Index (14) is moving in the same direction below the 40-level, suggesting sideways movement in the market.
Alternatives to Bitcoin
Looking at the daily chart, the Bitcoin price is struggling to stay above $28,000 as the king coin declines heavily and more may still come if there is a close below the 21-day moving average. Nevertheless, a better new token called Love Hate Inu (LHINU) has achieved almost $2m in the presale. However, Love Hate Inu ensures you have the chance to voice your opinion and find a supportive community.
Love Hate Inu – Newest Meme Coin

Early Access Presale Live Now
Ethereum Chain
Featured in Yahoo Finance
Mint Memes of Survey Results as NFTs
Staking Rewards
Viral Potential, Growing Community
Join Our Telegram channel to stay up to date on breaking news coverage