Bitcoin Price Prediction: BTC/USD Skyrockets Past $61,000


Bitcoin Price Prediction – October 15
The Bitcoin price prediction shows BTC facing the upside as the technical indicator on the daily chart moves into the overbought region.
BTC/USD Long-term Trend: Bullish (Daily Chart)
Key levels:
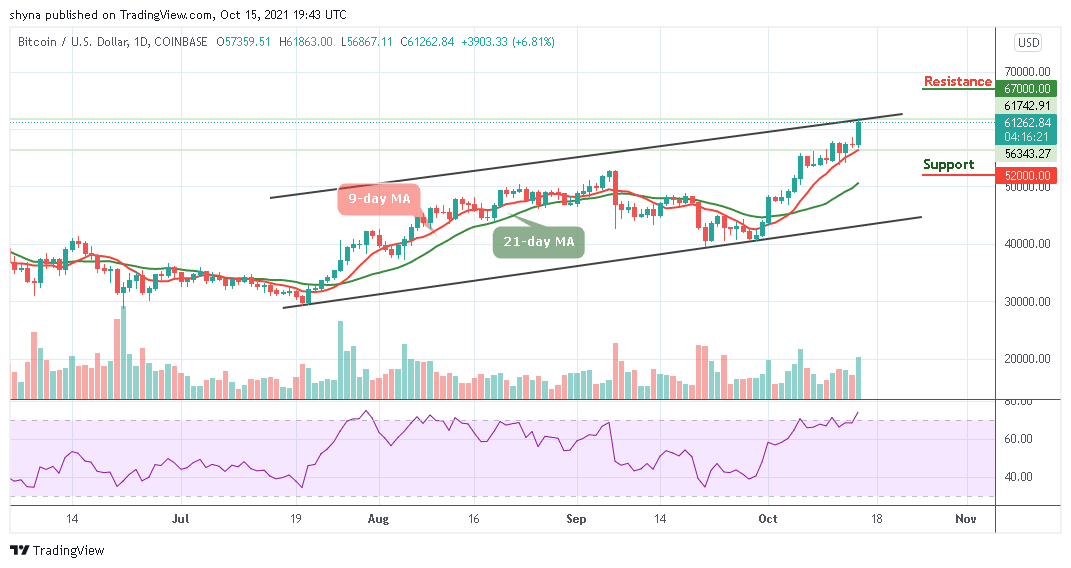
Resistance Levels: $67,000, $69,000, $71,000
Support Levels: $52,000, $50,000, $48,000
BTC/USD is currently trading above the important resistance level of $61,000 as the king coin moves higher to trade at $61,262 at the time of writing. However, the number one crypto is seen moving with a strong bullish movement after a sustainable break above the channel.
Bitcoin Price Prediction: Bitcoin (BTC) May Gain More
Looking at the daily chart, the technical indicator Relative Strength Index (14) is moving within the overbought region. Additionally, the Bitcoin price seems to have reached the upper boundary of the channel coming from the 9-day moving average, suggesting that BTC/USD could hit another resistance level at $65,000, before attempting to break lower.
At the time of writing, the 9-day and 21-day moving averages continue to head higher, showing a significant bullish pressure. On the upside, the $62,000 level aligns as the nearest resistance. However, a daily close above that level could push the price to $67,000, $69,000, and $71,000.

On the contrary, the Bitcoin price could retreat below the 9-day moving average if the king coin failed to cross above the upper boundary of the channel. More so, if it breaks below the 9-day moving average, it could hit the critical support levels at $52,000, $54,000, and $56,000 respectively.
BTC/USD Medium – Term Trend: Bullish (4H Chart)
Looking at the 4-hour chart, the Bitcoin price is currently in the ascending range of the medium-term outlook as the target market is keeping the support level of $58,500 and below. But the Bitcoin market is gaining momentum with the support of a 9-day moving average as the buyers keep the position intact
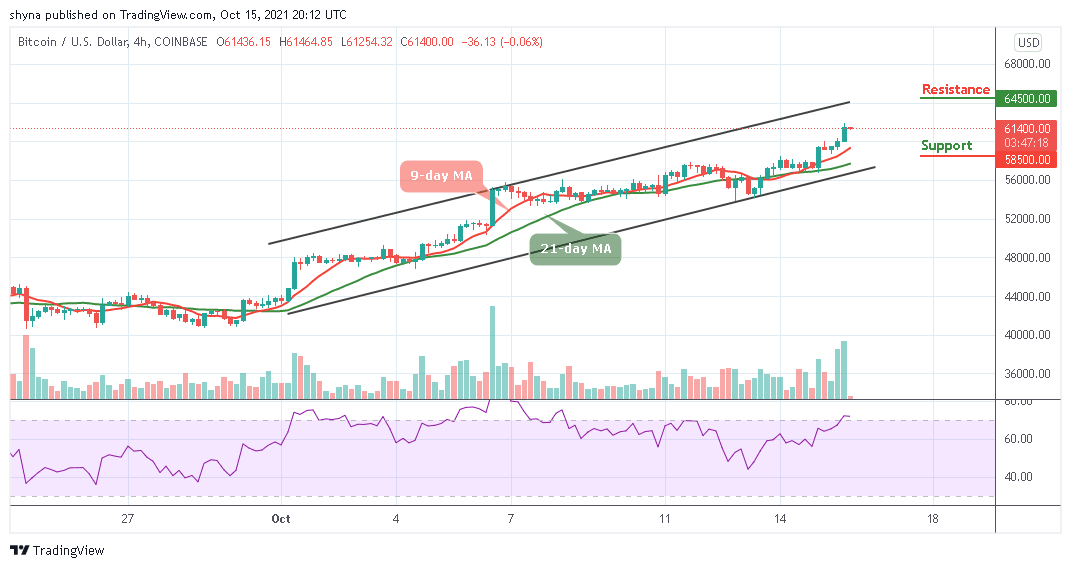
Looking at the Relative Strength Index (14) indicator, it shows that BTC price may keep the upward movement before a retreat could take place. Moreover, any further bullish movement towards the upper boundary of the channel may hit the resistance level of $64,500 and above.
Looking to buy or trade Bitcoin (BTC) now? Invest at eToro!
67% of retail investor accounts lose money when trading CFDs with this provider
Read more: