Bitcoin Price Prediction for Today, October 3: BTC/USD Shows Bullish Signals


Join Our Telegram channel to stay up to date on breaking news coverage
The Bitcoin (BTC) price prediction has been facing some mixed price action in recent days, with the crypto seeing multiple strong uptrends and selloffs.
Bitcoin Price Prediction Statistics Data:
Bitcoin price now – $19,223
Bitcoin market cap – $368.3 billion
Bitcoin circulating supply – 19.1 million
Bitcoin total supply – 19.1 million
Bitcoin Coinmarketcap ranking – #1
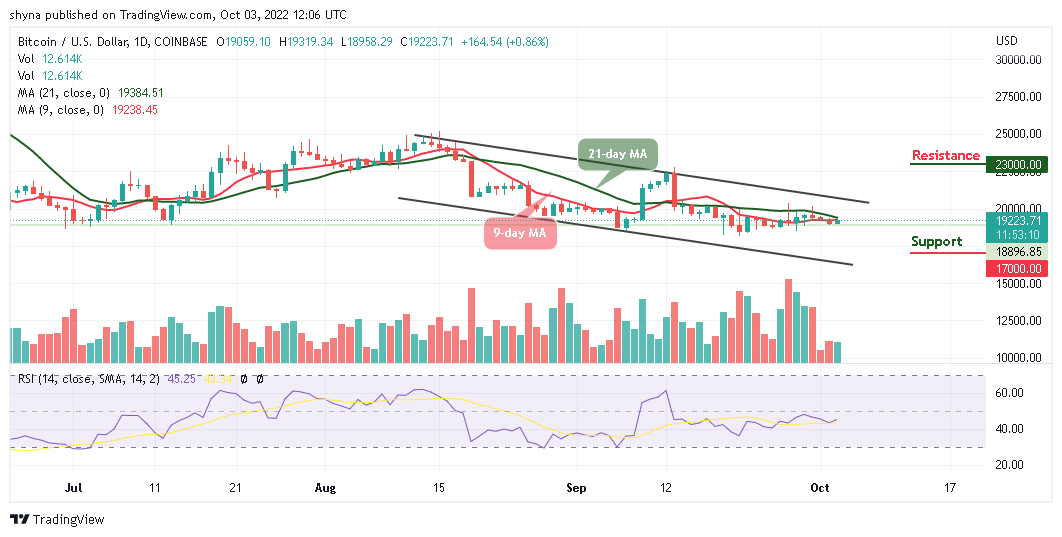
BTC/USD Long-term Trend: Ranging (Daily Chart)
Key levels:
Resistance Levels: $23,000, $25,000, $27,000
Support Levels: $17,000, $15,000, $13,000
Buy Bitcoin Now
Your capital is at risk
At the time of writing, BTC/USD is trading up just above 0.86% at its current price of $19,223, which marks a notable surge from recent lows of $18,958 that were set in the early hours of today. However, the king coin’s strength is showing few signs of degrading, with bulls aggressively buying each dip as bears struggle to gain any momentum. Meanwhile, where the crypto trends in the mid-term will undoubtedly depend largely on whether or not it can break above $19,319.
Bitcoin Price Prediction: What to Expect from Bitcoin (BTC)
At the time of writing, the Bitcoin price is trading up marginally at its current price of $19,223. Although this marks a meaningful climb from the opening price of $19,059, it is important to note that this could mark a bull-favoring break above the 9-day and 21-day moving averages.
Meanwhile, as the technical indicator Relative Strength Index (14) faces the north, a sustainable move above the 50-level could locate the nearest resistance of $22,000, reaching this may allow for an extended recovery towards $23,000, $25,000, and $27,000 respectively. On the contrary, any bearish movement towards the lower boundary of the channel may force the Bitcoin price to hit the supports at $17,000, $15,000, and $13,000.
BTC/USD Medium-term Trend: Ranging (4H Chart)
According to the 4-hour chart, BTC/USD should recover above the 9-day and 21-day moving averages to mitigate any short-term bearish pressure and allow for an extended recovery towards $19,500. A higher resistance may be found at $20,000 and above.
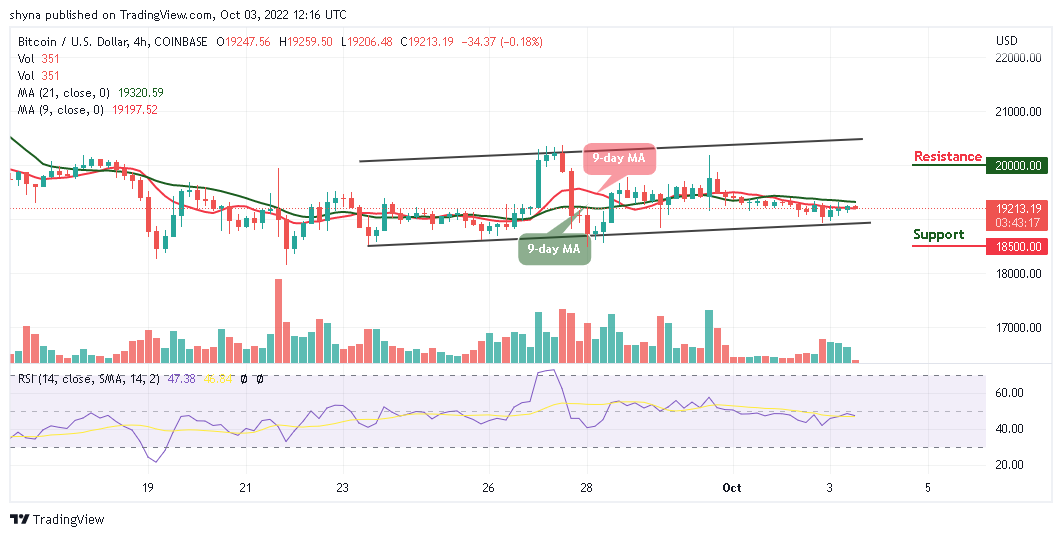
In contrast, the nearest support is located at $19,000, and a sustainable move below this level may increase the downside pressure and push the price towards the support level of $18,500 and below. Considering that the technical indicator Relative Strength Index (14) could revert to the upside, therefore, traders might expect that more bullish signals are coming into focus.
Tamadoge – Play to Earn Meme Coin

Maximum Supply of 2 Bn, Token Burn
Now Listed on OKX, Bitmart, Uniswap
Upcoming Listings on LBank, MEXC
Join Our Telegram channel to stay up to date on breaking news coverage