BTC/USD Dumps Below $60,000; Is Bull-run Over?


Bitcoin Price Prediction – October 27
The Bitcoin price prediction reveals that BTC drops close to $2,000 within few minutes from over $60,000 to hit the daily low at $58,100.
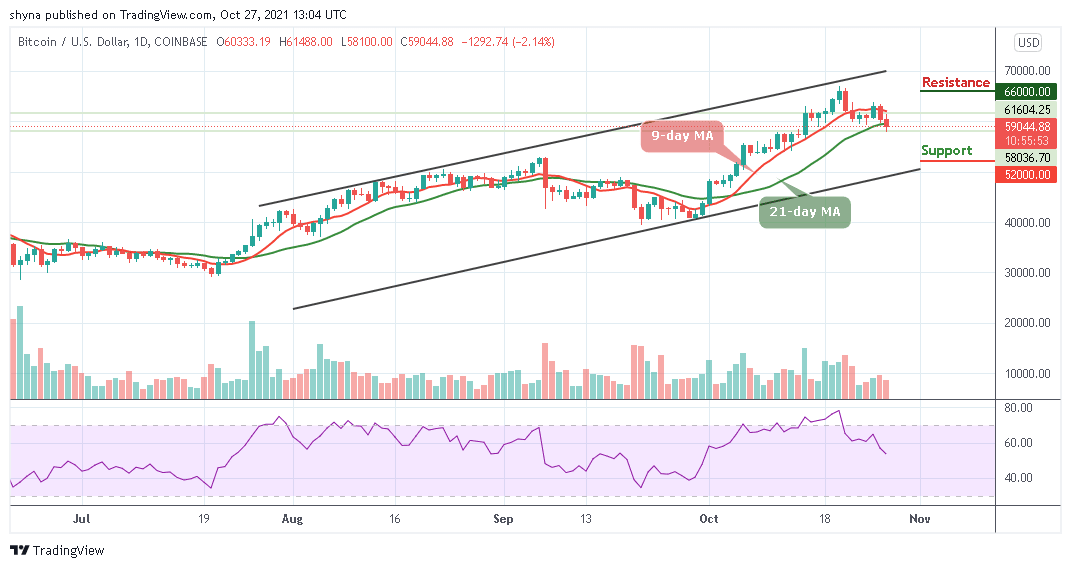
BTC/USD Long-term Trend: Ranging (Daily Chart)
Key levels:
Resistance Levels: $65,000, $67,000, $69,000
Support Levels: $53,000, $51,000, $49,000
BTC/USD is currently trading below the $60,000 level as the price crosses below the 9-day and 21-day moving averages. Meanwhile, the bearish movement may be coming to play out according to the technical indicator which indicates that the king coin may likely drop more before regaining back its strength towards the upper boundary of the channel again.
Bitcoin Price Prediction: Bitcoin (BTC) Correction Could Be Short-Lived
At the time of writing, the Bitcoin price is changing hands at $58,917, which marks a significant rally below the moving averages. Nevertheless, where the king coin trends next may depend on whether or not the red-line of the 9-day MA could cross below the green-line of the 21-day MA. Meanwhile, should in case this comes to play, it may definitely drag the prices lower and traders may expect the Bitcoin price to fall below $55,000 support which could later move towards the critical support levels at $53,000, $51,000, and $49,000.
On the other hand, if the Bitcoin price failed to close below the $60,000 level; the price may cross above the 9-day and 21-day moving averages and crossing above this barrier could send the price to the resistance levels of $65,000, $67,000, and $69,000. More so, the technical indicator Relative Strength Index (14) continue to reveal a sign of trend reversal, which shows a more bearish signals may surface in the market soon.

BTC/USD Medium – Term Trend: Ranging (4H Chart)
On the 4-hour chart, BTC/USD is currently trading around $59,144 below the 9-day and 21-day moving averages after a reversal from $58,100 where the market touched today as the Bitcoin price moves around the lower boundary of the channel.
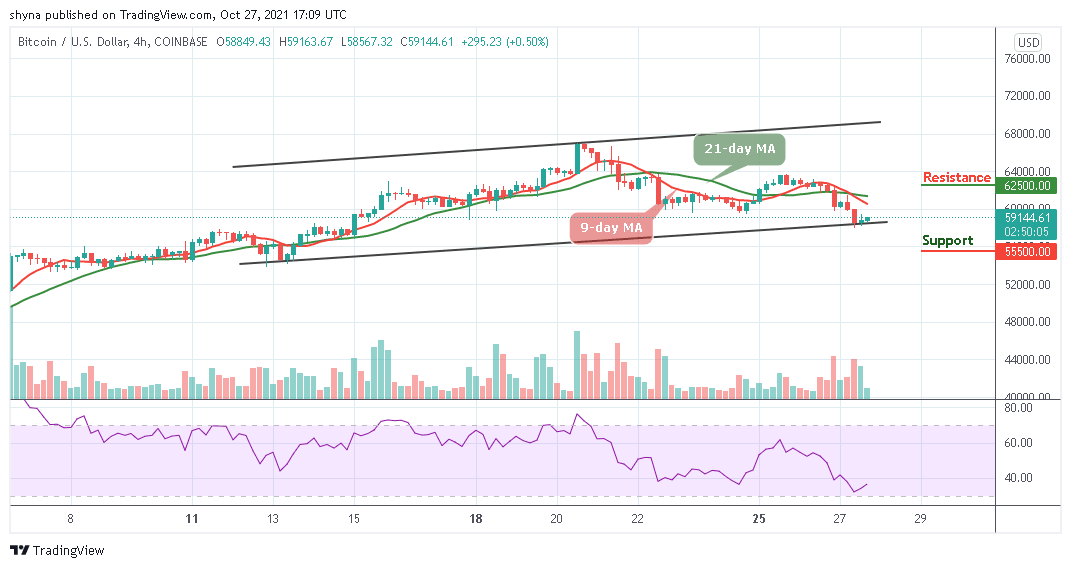
However, as soon as the buyers energize the market, they can further push the price above the 9-day and 21-day moving averages and this could take the market price towards the resistance level of $62,500 and above. Meanwhile, as the 4-hour chart reveals, the Relative Strength Index (14) is likely to cross above 40-level but any bearish movement into the oversold region may bring the price to the support level of $55,500 and below.
Looking to buy or trade Bitcoin (BTC) now? Invest at eToro!
68% of retail investor accounts lose money when trading CFDs with this provider
Read more: