BTC/USD Price Battles with $63,000


Bitcoin Price Prediction – November 1
The Bitcoin price is likely to spread the bearish move to areas below $61,000 after numerous attempts to hold gains above $65,000.
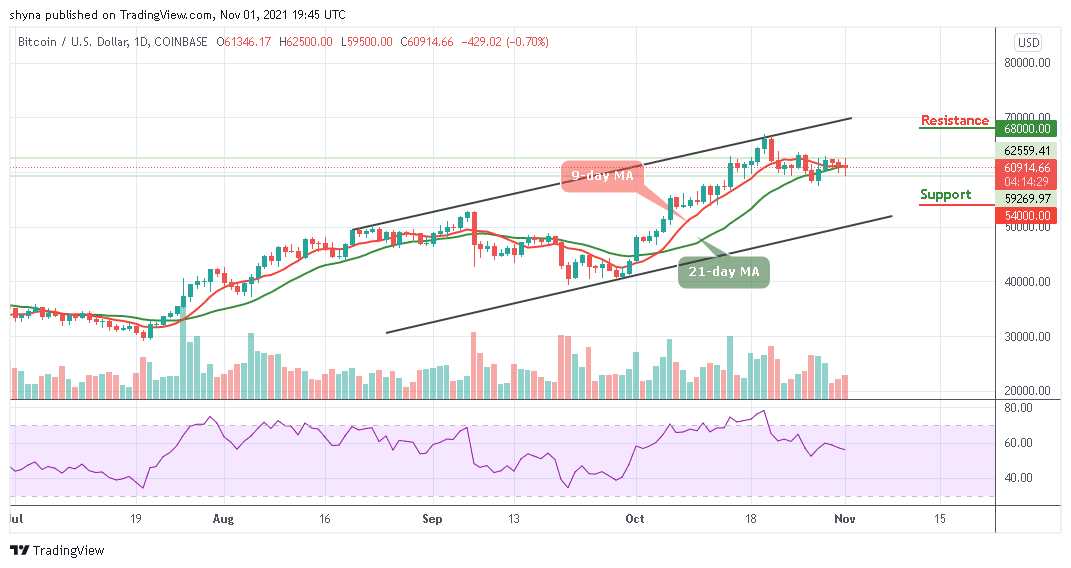
BTC/USD Long-term Trend: Ranging (Daily Chart)
Key levels:
Resistance Levels: $68,000, $70,000, $72,000
Support Levels: $54,000, $52,000, $50,000
BTC/USD falls below $62,000 as the largest cryptocurrency embarked on a support smashing exercise after failing to hold above $62,500 following a significant breakout in the last few days. Hence, the bearish control has been seen across the market, with other major digital assets seeing similar losses when trading below the 9-day and 21-day moving averages.
Bitcoin Price Prediction: BTC Price May Go Lower
The Bitcoin price is trading at $61,438 with an intraday loss of 0.15% as the prevailing trend is likely to follow the bearish movement. However, Bitcoin (BTC) is currently consolidating within the channel and a breakout of this pattern in the direction of the previous trend is expected to continue. In the meantime, BTC/USD is expected to fall and stay below the 9-day and 21-day moving averages which may likely move towards the critical support levels at $54,000, $52,000, and $50,000.
However, if the Bitcoin price stays above the moving averages; the price could rise to $65,000 vital resistance while a further bullish drive could take the coin to the resistance levels of $68,000, $70,000, and $72,000 respectively. Moreover, the technical indicator Relative Strength Index (14) is currently moving below 60-level, which shows a possible bearish momentum may play out or the coin may range-bound before moving higher.

BTC/USD Medium – Term Trend: Bearish (4H Chart)
As the market opens today, the Bitcoin price touches the daily low of $59,500, but now hovering around $61,027. Should the price drop further below the 9-day and 21-day moving averages, it could hit the next level of support at $59,500 and below.
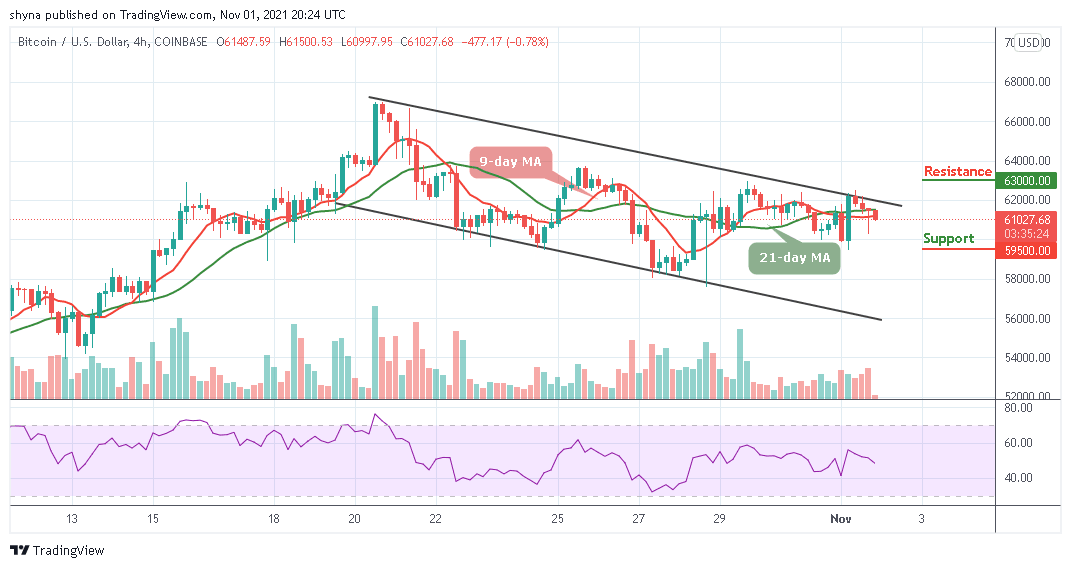
However, should the bulls push the coin above the upper boundary of the channel, the Bitcoin price could hit the potential resistance level of $63,000 and above. For now, the market may continue to experience a downtrend as the technical indicator Relative Strength Index (14) slides below 50-level.
Looking to buy or trade Bitcoin (BTC) now? Invest at eToro!
68% of retail investor accounts lose money when trading CFDs with this provider
Read more: