Ethereum, Cardano, Ripple, Shiba, and Doge


This week was very intense in terms of price action, and we take a look at Ethereum, Cardano, Ripple, Shiba, and Doge.
Ethereum
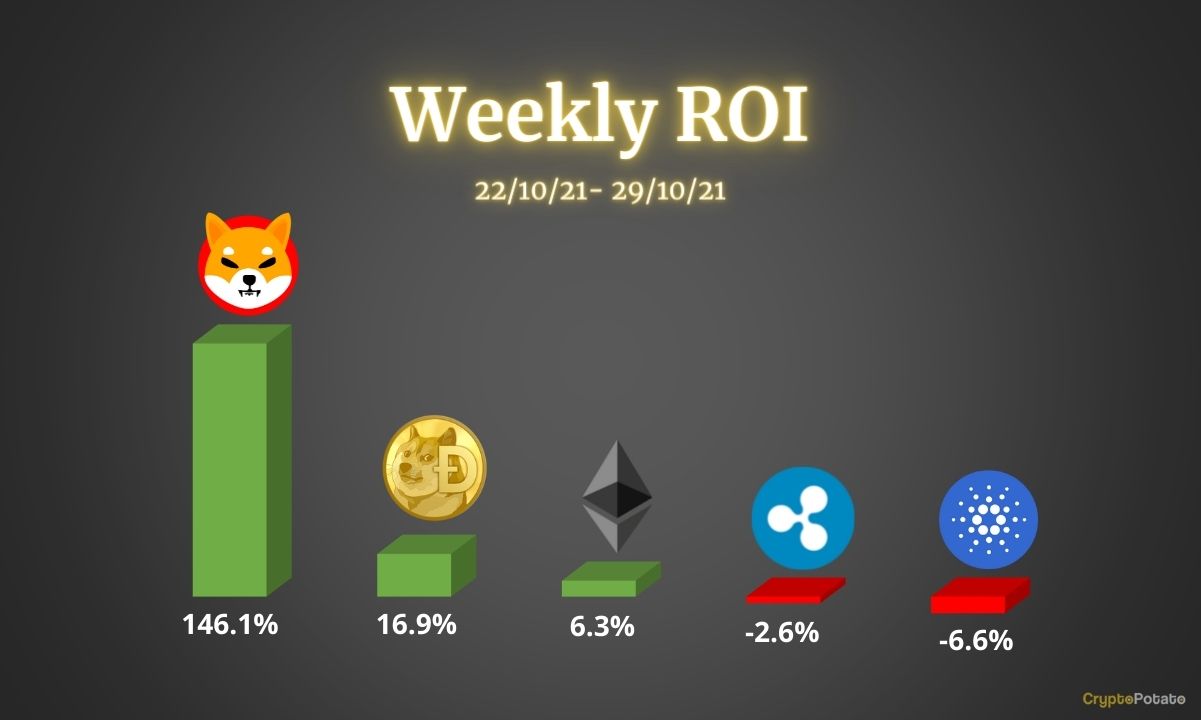
After a lot of anticipation, Ethereum has finally managed to set a new all-time high today. At $4,400, this new peak is a bit of a disappointment considering the previous one was at $4,380. The bulls did not have the strength to push higher, but this may change in the following week. Overall, another good week for ETH with a 6.3% rally.

The price action in the previous week may have made some traders dizzy, particularly because of that short-lived drop below $4,000 on October 27th, which recovered a day later. The key support and resistance remain at $4,000 and $4,400, respectively.
Looking ahead, Ethereum seems prepared to have an excellent start in November. The bulls are playing with the top resistance, and that can soon fall again as pressure continues to build up below it. On the daily timeframe, Ethereum appears primed for a continuation of this rally in the search for a new top.
Cardano
This week, Cardano fell below the range discussed last week and found support on the $1.9 level. This places ADA back into the descending channel and within the larger price range of $1.9 and $2.4.

This drop also made ADA’s indicators bearish on the daily timeframe. Therefore, bulls need to wake up if there is hope to bring the uptrend again. Overall, ADA performed poorly this week with a 6.6% drop.
The bulls did show appetite to buy ADA at the new support, which so far has held well. If this is sustained in the new week, perhaps the bulls can push the price above the descending channel again and attempt a new try to break the resistance at $2.4. That seems a bit far away, but a week in crypto is a lot of time for the price to move.
Ripple
Similar to ADA, Ripple also suffered a sharp drop from the descending triangle discussed last week. Overall, XRP disappointed with a 2.6% decline over the past seven days. The support at $0.96 held, and the price bounced back into the blue pennant. This brings us back by a few days as XRP will again need to decide which way to go. A break above the pennant can take it quickly to $1.2, which acts as resistance.

A break of the pennant can be expected early next week. If the overall market remains bullish, XRP has a good chance to try an escape and move higher.
However, the daily timeframe indicators are not that encouraging, and XRP needs to move higher to change the bearish bias on the MACD. There is some hope since on lower timeframes, such as the 4-hour, the MACD did a bullish cross yesterday, but volume continues to disappoint. Volume can be interpreted as the quality of the price. The higher the volume, the higher the confidence in a particular price. Confidence in XRP price right now is rather low.
Shiba
The excitement and euphoria were not around ADA or XRP this past week. Rather, it was in another section of the crypto community, and it involved a lot of memes where Shiba took the spotlight with no less than a 146% rally this week.

The surge was the headline across the industry, and the price finally came to a break once it hit the current all-time high of $0.00008854. As already indicated in our last Shiba analysis, all eyes are now on the key level of $0.0001. The big question in everyone’s mind is, can SHIB lose another zero? That would certainly gather a lot of attention.
Until then, Shiba has found support on the $0.0000600 level and is expected to consolidate further under the all-time high before another attempt is made at a breakout. The indicators remain bullish on higher timeframes such as daily and above, while on lower timeframes like 4-hours, the correction appears completed.
Looking ahead into the coming week, there is a possibility Shiba can attempt a break of the $0.0001 level.
Doge
Similar to Shiba, Doge’s price action this past week was rather intense, particularly on October 27th and 28th. After breaking above the blue pennant, Doge started to rally but was sharply pushed down during a flash crash that took the whole market down on October 27th and 28th. Nevertheless, Doge bounced back with a 46% green candle a day later. Overall, this week Doge rallied 16.9%, which is a very respectful performance.

The current support for Doge can be found at $0.255, and the key resistances ahead are at $0.30 and $0.38. Breaking these levels could propel it in a significant new rally. Yet, at the time of this writing, bulls appear to be weaker on the lower time frames.
The indicators on Doge remain bullish on higher timeframes. This leads to an expectation to see higher price levels in the coming week. Meme coins have performed much better than the overall market lately, and this trend may continue in the future as well. Doge is no different.
Binance Futures 50 USDT FREE Voucher: Use this link to register & get 10% off fees and 50 USDT when trading 500 USDT (limited offer).
PrimeXBT Special Offer: Use this link to register & enter POTATO50 code to get 50% free bonus on any deposit up to 1 BTC.
Disclaimer: Information found on CryptoPotato is those of writers quoted. It does not represent the opinions of CryptoPotato on whether to buy, sell, or hold any investments. You are advised to conduct your own research before making any investment decisions. Use provided information at your own risk. See Disclaimer for more information.
Cryptocurrency charts by TradingView.